
You have to start somewhere right?
When you’re looking to validate a software product it’s no good jumping on the phone and talking to people before you know the lay of the land. You’ll likely look under-prepared and unprofessional.
You need some collateral. And it’s not just about establishing credibility for yourself by researching the market first, it also helps you understand the type of information you are going to need further down the track to make it all work out.
This is where the FlypChart journey all began, with secondary research.
Secondary research is the search for information that is already currently available. Compared to “primary” research, which involves gathering inputs yourself through things such as surveys and interviews. (I’ll talk more about how we used these tactics when I reveal the “validation” strategy in a later blog post)
Even though this secondary research would inevitably shape the direction of the business, looking back it was really just a way to confirm my suspicions and determine if there were enough people out there who could buy this product.
There were four key areas that guided this research process:
- Learning about the industry and launching a software business
- Defining the type of customers we could help
- Uncovering the market size and growth potential
- Assessing the already established competitive landscape
The rest of this post will touch on some of the key information we gathered during this research, as well as show you the steps we took to find it.
Let’s take a closer look…
Learning
You will notice a common theme coming through in most of my blogs, and it’s about learning. Everything I do is about learning, and then adapting based on what I have learnt as quickly as possible.
For me, this whole journey has been as much about learning how to launch a software business as it has been about validating this concept.
I’ve read stories of success, listened to SaaS experts on podcasts, crawled the internet for potential pitfalls, read tons of books, and badgered a long list of successful software entrepreneurs for 15 minutes of their time. Many of whom were happy to share their story.
I was literally grabbing anything and everything I could get my hands, ears or eyes on that was going to shortcut the learning process.
How did I find appropriate learning opportunities?
1. Amazon
The first stop was Amazon. Seeing it offers the most in-depth book selection and product review system in the world, it seemed like a great place to start.
I scribbled down a list of potential search terms on a piece of paper, and jumped straight into their book search.
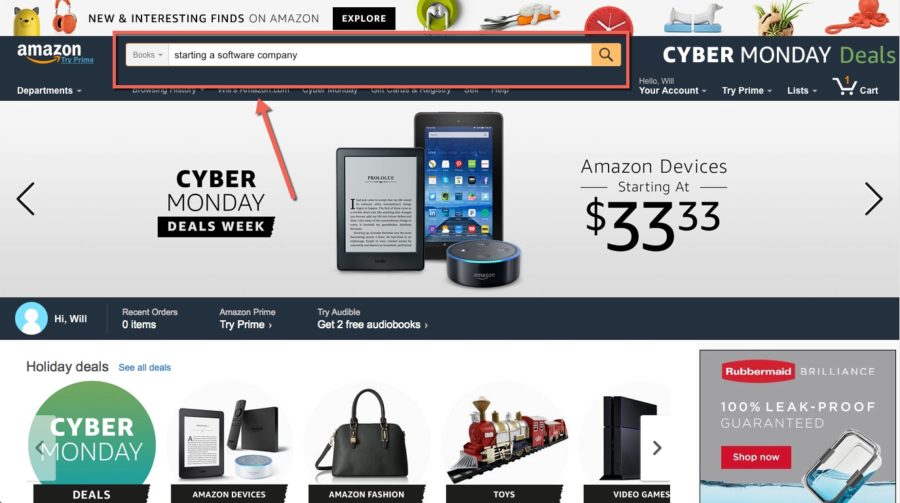
Some of the terms I searched for included:
- starting a software company
- validating a product
- launching a software business
- customer development
- growing a startup…
This list was pretty lengthy, so I won’t keep going… But the goal was to cast a wide net so that I could find the best possible books out there.
Within each of these searches I then filtered them by “Avg. Customer Review”, to get the most popular books to the top of the list.
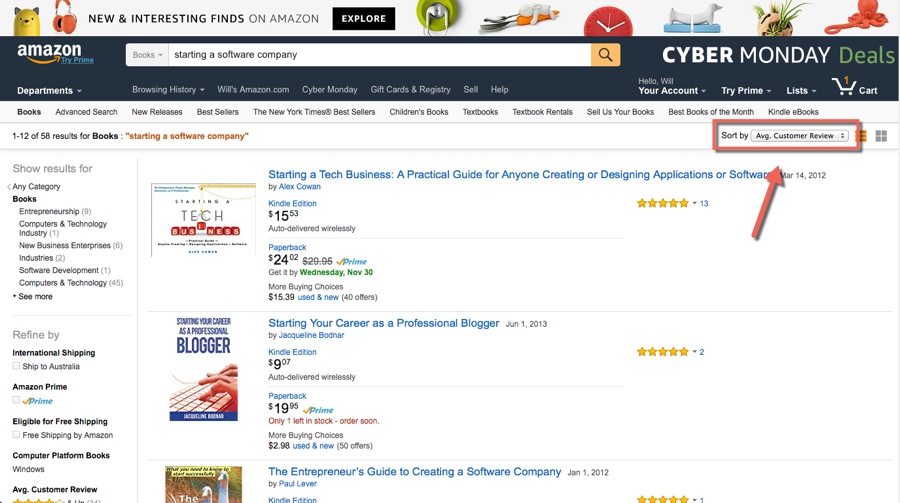
After about an hour of reading through book reviews and descriptions, I landed on a list of 5 books that I would then purchase and read.
2. Google
Next, I took the search to Google to find relevant blogs or podcasts that were going to provide similar value to this book list.
This started with a pretty similar list of search terms, but then I got a little bit creative.
For example, I started to look for roundup posts of the best blogs in the SaaS and startup space:
- best startup blogs 2016
- top startup podcasts 2016
- best SaaS blogs 2016
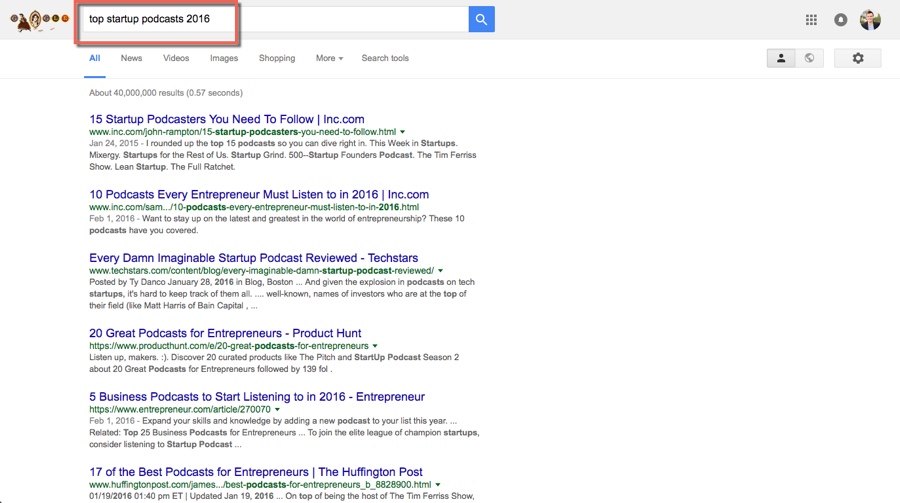
You get the idea.
Once again, I narrowed this list down to about 5 blogs and a couple of podcasts that I could start to dive into.
3. Asking my network
The final thing I did to round out this search for relevant learning material was to ask my network.
I went to other people who had started successful software businesses from scratch and asked them who or what they learnt from.
I kept this group pretty small, because any high-end relationships I had in this area were going to extremely valuable as the validation phase kicked off… So I didn’t want to bombard them.
Resources
Here are some of the most interesting resources I took inspiration from during this process. There is a mix between startup, product validation and growth tips:
- Groove HQ Startup Journey by Alex Turnbull
- The Startup Chat Podcast with Steli Efti and Hiten Shah
- Joel.is by Joel Gascoigne (Buffer Founder)
- SujanPatel.com – by Sujan Patel
- OnStartups by Dharmesh Shah
- Lean Customer Development: Building Products Your Customers Will Buy by Cindy Alvarez
- Create products that people love by validating your idea first by Hiten Shah
- The Lean Startup by Eric Ries
Customers
So who is FlypChart going to target?
I used to think the answer to that question was linear… But it’s FAR from that. It’s complicated.
And in fact the further we get down this validation path, and the more information we uncover, the more interesting the answer to this question has become.
Because as it turns out, the concept of FlypChart (in it’s current state) is actually quite beneficial to a lot of different marketers. However, the specific problems it solves for each different marketer can vary.
For some, it’s about de-cluttering their browser tabs and bringing everything into one place.
For others, it’s more about getting visibility across multiple projects all at once, and making sure people within their team are accountable to certain activities.
And for others, it’s about replicating effective marketing campaigns time and time again without re-creating the wheel.
Based on these three problems we created three customer avatars (or buyer personas) that breakdown the demographics, interests, aspirations, problems, and business attributes of these ideal buyers – or at least based on what we know about them at this very early stage.
The way these avatars are currently grouped are as follows:
- Digital Entrepreneurs or Small Business Owners
- Marketing Agency Heads
- Small Business Marketing Managers
Of course each of these three customer types have a varying degree of each problem, but whether or not we prioritize the functions that solve these problems in the first release of the product will greatly determine who is willing to buy it.
What information did we want to know about these avatars?
They aren’t perfect, and they’re likely to change and adapt as we continue along this journey, but the way we defined these customer avatars was by attempting to answer a set of important questions about each of them:
- What core problem are we solving for them?
- Who are we solving this problem for? (Describe them in one sentence)
- Are they willing to pay to fix this problem? For example, are they paying for other product(s) that serve a similar purpose?
- What is their typical age and sex?
- Where do they live? (Geography)
- What are some common interests or hobbies they share?
- What is their average yearly salary?
- What other daily challenges do they face?
- What are some potential objections to this product they may have?
- What other systems/processes/tools/habits are we competing with for their time and resources?
- What are the most important purchase criteria for these customers?
- What change do these customers expect to see from purchasing this product?
- What information do they need at every stage of the buyer’s journey? Awareness/Research/Decision
- What publications do they read on a regular basis?
- Are there any key figures in the industry that these customer’s admire? (Social media influencers, bloggers, authors, publications etc.)
By answering these questions, it helped us form three more in-depth customer profiles that would help guide the rest of our research and validation.
How did we find this information?
As you can see this whole secondary research process isn’t sequential. Because each element helps fuel the research of the other elements. So I found myself continually doubling back and improving the findings of each stage as it went on.
To learn more about who our potential customers were, and what made them tick, it made sense to gaze into the world of our competitors.
Any other product, service, tool or application that is, or will be, fighting for our customers time and resources.
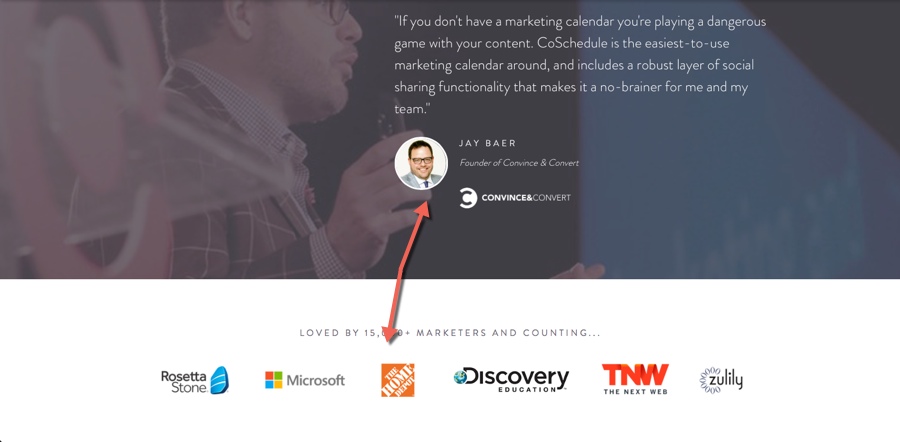
By looking at the marketing messages of these potential competitors, it gave us an insight into the customer avatars each of them were targeting. As well as the problems they were trying to solve for them.
There were three places that I found the most interesting information:
- Company testimonials and brand mentions – this gave us an insight into the type of customers that used the tools. Like the ones below from CoSchedule, a software that people will inevitably compare FlypChart to. (Quick fire comparison: they don’t do integrations with email, webinars and ad platforms, we will)
- Blog posts – see what information they are writing about and how they frame it for their customers.
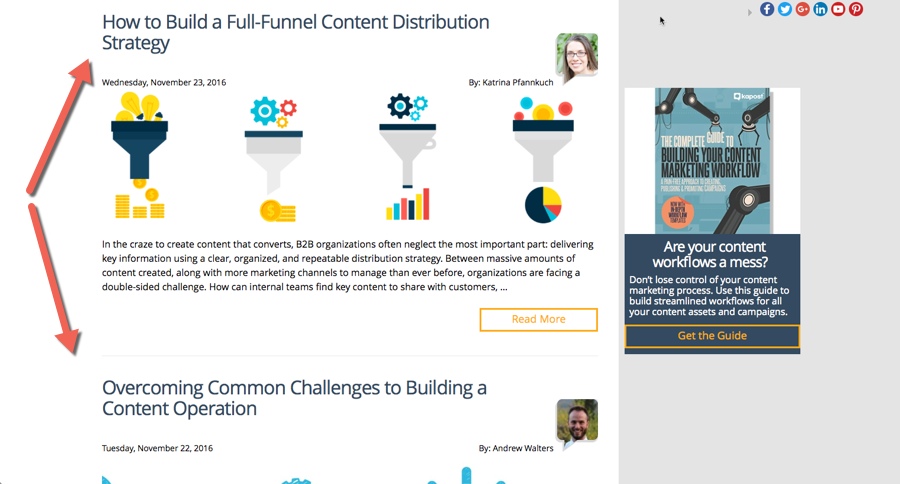
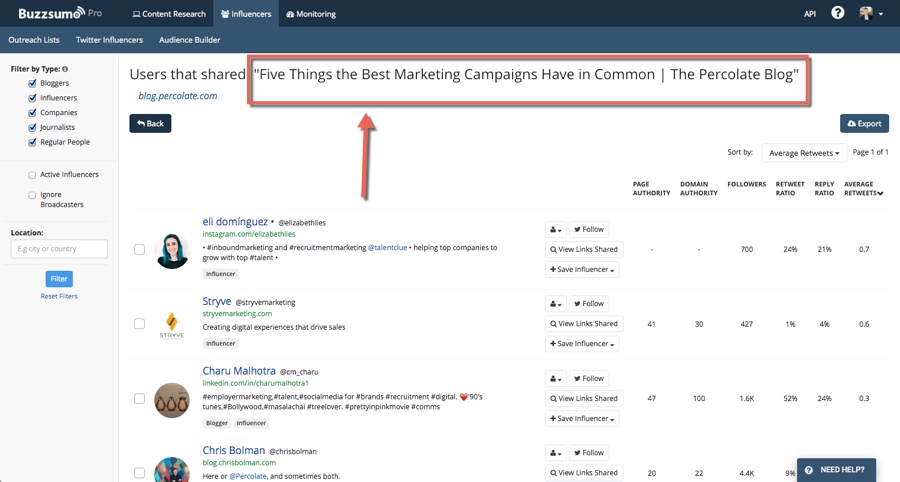
- Social shares – who is sharing their content on social media? I used BuzzSumo to discover the type of people that were sharing content from competitors, and were presumably interested in running digital campaigns.
Complementary tools
Going beyond the competitors, there was a lot of valuable information about our potential customers in the complementary tools and products they were using.
This bit of research was interesting for several reasons:
- It helped us better understand the customer avatars and what products already made it into their workflow
- It revealed a list of potential partners that could aid the fast growth of the business
- It let us know what tools would make it onto the “potential integrations” list
Some of this discovery was done on “feel”, or pot luck Google searches. (Guilty)
But the most valuable information came from asking people… (This is skipping ahead to the primary research, but as I said the process isn’t perfectly linear!)
“What tools do you currently use to plan and schedule digital marketing campaigns?”
What I’ve found is that the typical person within our target market uses a combination of; a project management tool (like Asana or Trello), email software (such as Infusionsoft or Mailchimp), webinar software (such as GoToWebinar or Webinar Ninja), social media scheduling tools (such as Hootsuite or Buffer), a spreadsheet, and Google Calendar.
This is just a small snapshot. So not only did these complementary tools give me an insight into the customer avatars, but it also served as some form of validation that this “tool overload” problem was real.
Market Size and Growth Potential
I didn’t want to build a product that had no potential to grow and deliver value to a big audience. But I didn’t really know how to find the type of information I needed to figure this out…
Deep down I think I was hoping that some statistician had already done the research and published it for free. That wasn’t the case. Instead I had to rely on a mish-mash of a select few business revenue numbers, user growth predictions, industry forecasts, and expert “gut-feelings” about the market size and potential.
I wasn’t looking for an exact number for the size of the market, because that was going to be impossible to find. I just wanted enough information so that I could form some estimations on the number and financial potential of the customers we were targeting.
There were four key areas that helped reach these conclusions:
- Keyword research – I used the Google AdWords Keyword Planner in combination with ahrefs to find out how many people were searching for terms related to our solution, as well as the problem we were trying to solve.
- Market size – I was trying to find other research sources that had already estimated similar markets, so that we could make some estimates about the section of these markets we were targeting.
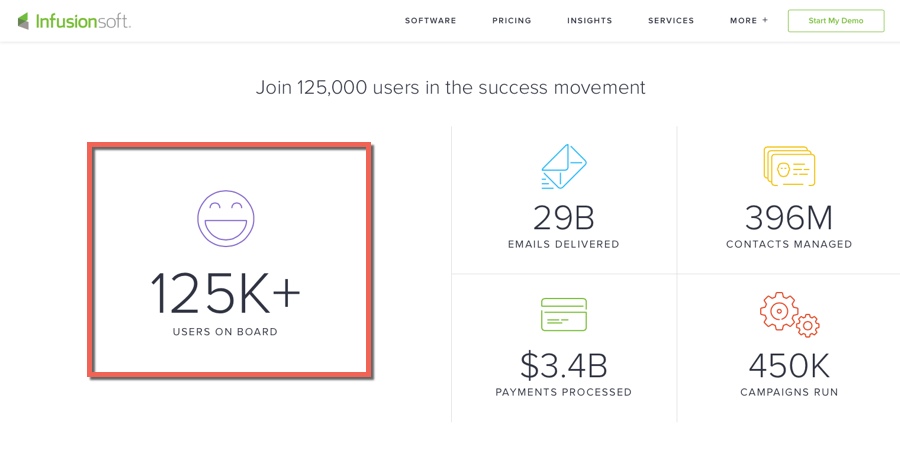
- User numbers – This was about finding the user numbers of competitor or complementary products. For example, Infusionsoft has an estimated 125,000 users (in 15 years of operation) and CoSchedule an estimated 30,000 users (in 3 years of operation).
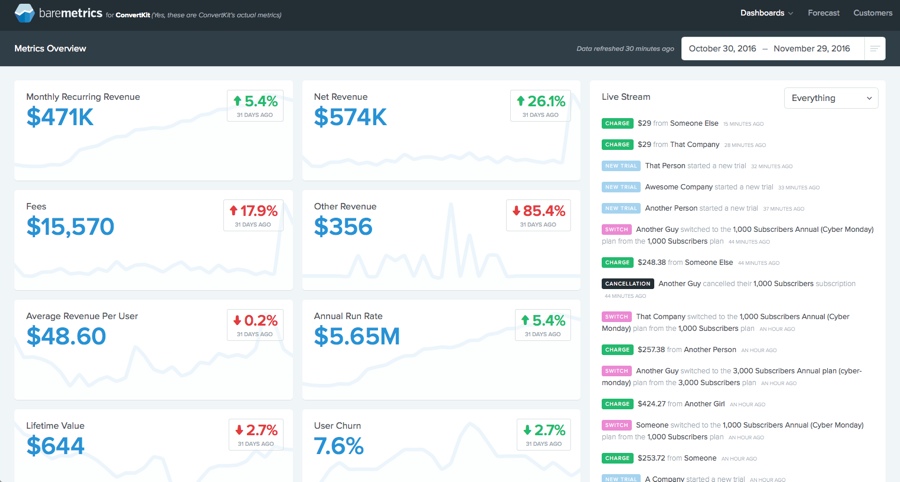
- Revenue and profitability – Much like the user numbers, I was looking for any businesses who were targeting a similar audience and had published revenue and profitability figures. CoSchedule is estimated to be making $2 million ARR after 3 years, and thanks to Baremetrics we were able to get an insight into the financials of other tools such as ConvertKit.
So what does all of this research actually mean?
Not much if you look at it in isolation, because in reality the potential market FlypChart is targeting is only a section of each of these inputs.
But when you put all of the information together (trust me, you wouldn’t want to see it ALL), it helps make some educated judgements about whether or not there is an opportunity to make a splash in this space. I think there definitely is.
Competitive Landscape
It turns out that there are a LOT of software products and tools out there. Many of whom deliver a part of the FlypChart value proposition, to what would be a very similar customer group.
But that’s ok… Because that means there is a need and people are willing to pay for it.
The main purpose of this part of the secondary research was to determine who we would be up against, and how we could differentiate ourselves in the market.
It wasn’t just about finding other solutions that were trying to solve the same problem. It was also about understanding how our ideal customers currently solved the problem, because that’s another thing we would be competing against for their time, resources and habits.
I started this research with some simple Google searches based on some gut-feelings:
- Marketing calendar software
- All-in-one marketing calendar
- Marketing campaign software
These searches helped me find competitors who were trying to solve a very similar problem, and I began constructing a list of them. For every new competitor I stumbled across, I would catch this information:
- Name and website
- Target customer
- Pricing
- Features
- Strengths
- Limitations
Here’s a short-form view of this information that I included in a market research document we used to recruit developers:
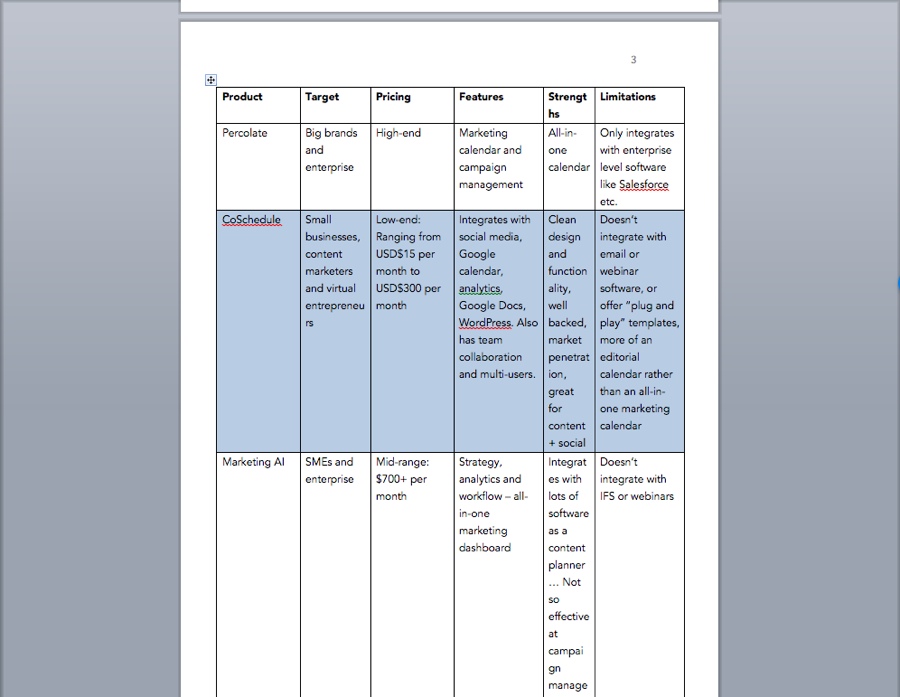
All of this information was going to help us position FlypChart where I believed the opportunity was in the market.
Conclusion
When I was doing most of this secondary research, it was all still a bit of a fantasy.
I’m not sure I genuinely believed that anything would come from it. I was kind of just waiting to find another solution out there that did exactly what I had envisioned. That could’ve derailed the dream.
It was also very hard not to have blinders on throughout this process. I keep asking myself, “Am I just hearing the good things and dismissing the potential dead spots with this idea?”
I still don’t know… but I’m at least aware of it. With every step along this road to validation I’m doing everything I can to keep a logical train of thought.
That in itself is extremely hard to do. Especially when you hear people fall-off-their-chair excited about the idea.
On the flip side, it’s hard not to lose faith when someone stares at you blankly or flat out says they aren’t interested.
The secondary research served its purpose. We now had a much better understanding of what we were up against in terms of the competitive landscape, market potential and our ideal target customers. The idea was validated enough to make the next part of the journey worth a crack.
Now I had to figure out exactly what it was we were going to build.


Great post Will.
It’ll be interesting to see how the product evolves over time and love that you’re doing plug & play campaigns.
Hey Ray,
Thanks mate… I appreciate the support. It’ll definitely be an interesting (and hopefully exciting) journey to see how the product develops.